
COVID-19
COVID-19 caused by the novel virus SARS-CoV-2 (severe acute respiratory syndrome Coronavirus 2) is currently spreading across the globe. Our objective is to track and monitor confirmed cases for various locations and to forecast new infections for the country or region. Blog posts with more details are to follow.
Disclaimer. Forecasts may be very unreliable due to the fact that forecasts are based on the presumption that no factors change. As regulations are implemented to control new infections and reduce disease spread (also see How countries around the world tried to contain the coronavirus), influencing factors are due to change and predictions will develop accordingly. As a rule of thumb, the further out the prediction, the less reliable; also bear in mind that the confidence bands are only at 80%.
IMPORTANT. Do not use for any decision-making etc.
#dontbeavector
Methodology
We developed a simple model to monitor confirmed COVID-19 cases by country or region using the 2019 Novel Coronavirus COVID—19 (2019-nCoV) Data Repository by Johns Hopkins CSSE. We use the Facebook Prophet library among other tools, which is a really great forecasting toolbox. Generally, predictions are highly unreliable because data is currently quite sparse and reporting may not be accurate. Moreover, important factors may change quickly. Computed models are updated regularly (once every hour) as infections spread; current data source provides updated data only once per day though. Models are likely to improve over time as more data becomes available and forecasts may vary as a result of changes in influencing factors. Moreover, note that changes in growth rates of confirmed cases might be due to changes in actual cases and/or changes in testing behavior.
Confirmed cases figures. The scale in the confirmed cases figures is logarithmic to base 10, the death rate figures use a linear scale. Black dots are data, blue line is prediction trend of new infections, and blue bands are 80% confidence bands. The dotted blue line is a 5-day moving average over new cases. The dashed black line shows the population of a given country or region. Black bars are actual new cases and blue bars are predicted new cases. Note that predicted new cases are very noisy, as we estimate in log-space; additive errors in the estimation turn into multiplicative ones for the new cases prediction. The error bars for the new cases are derived from the error bands for the cumulative estimation and as such not confidence intervals strictly speaking. Note that the new cases moving average and the total cases line are offset roughly by a fixed additive amount as long as we experience exponential growth; when countermeasures (such as curfews and lockdowns) start to be effective the two lines widen.
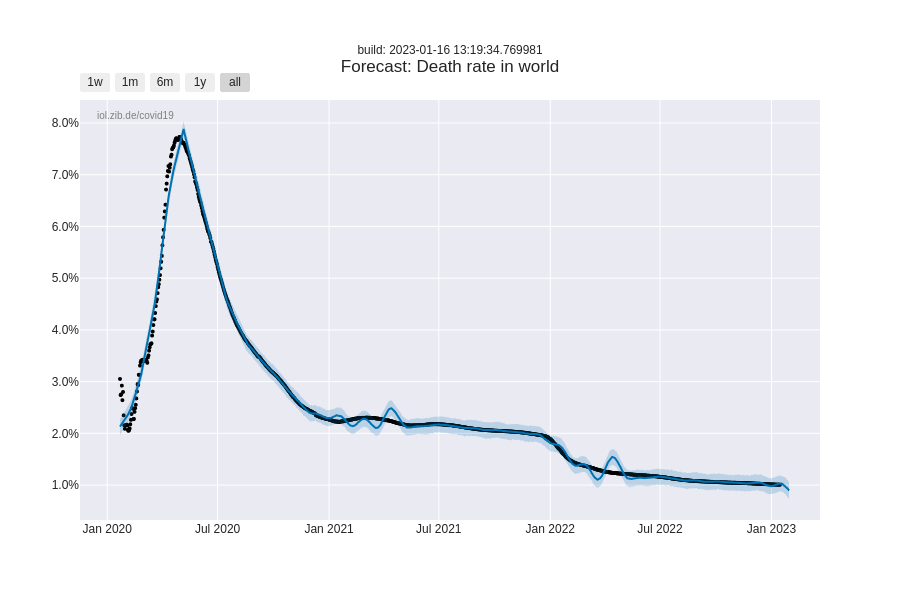
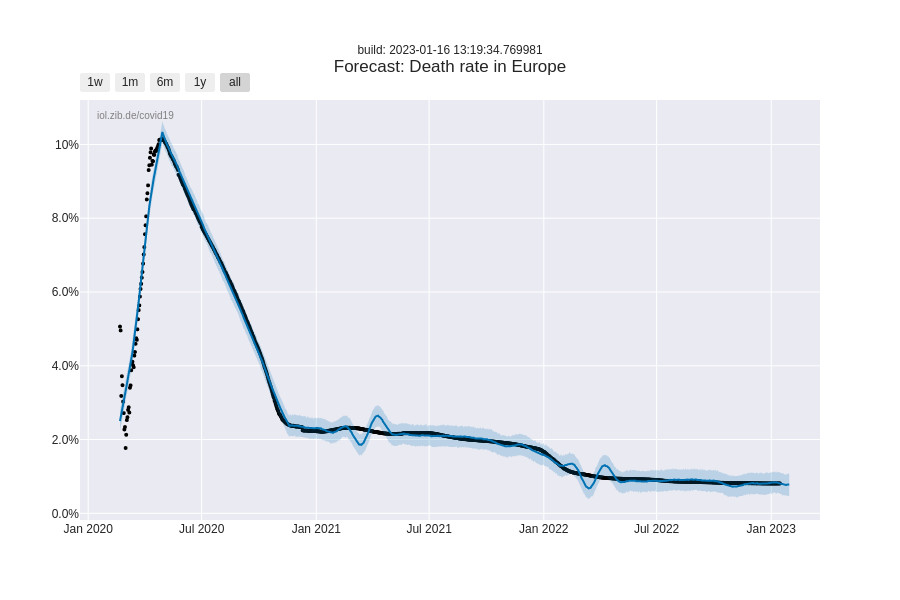
Death rate figures. (currently only for some locations) Depict a crude estimate of the empirical death rate. Note that the reported death rate is conditional on being tested and as such is subject to a selection bias. In particular, it is very likely that many of the less severe cases have been tested less (some cases might have been asymptomatic), so that it is expected that the death rate will drop (significantly) as more tests are conducted more uniformly.
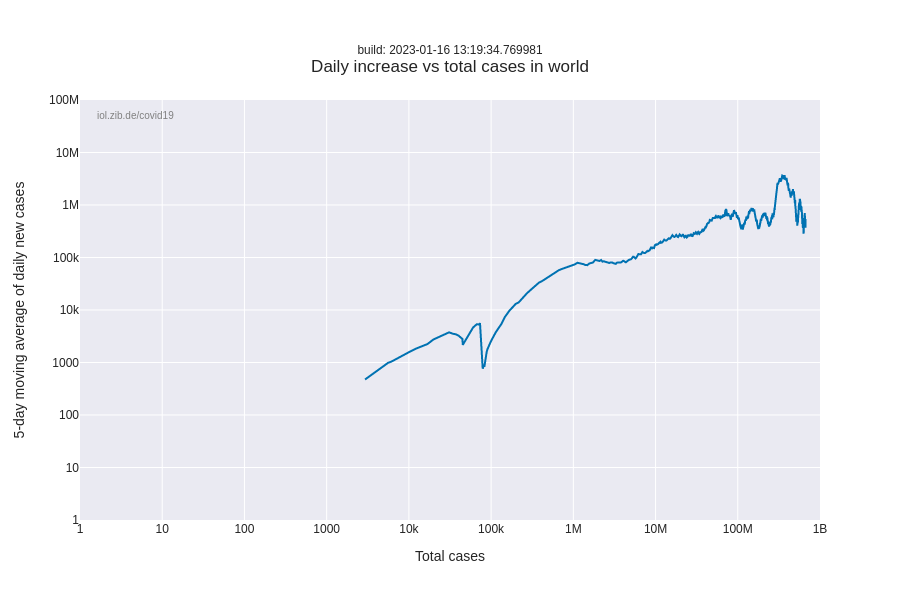
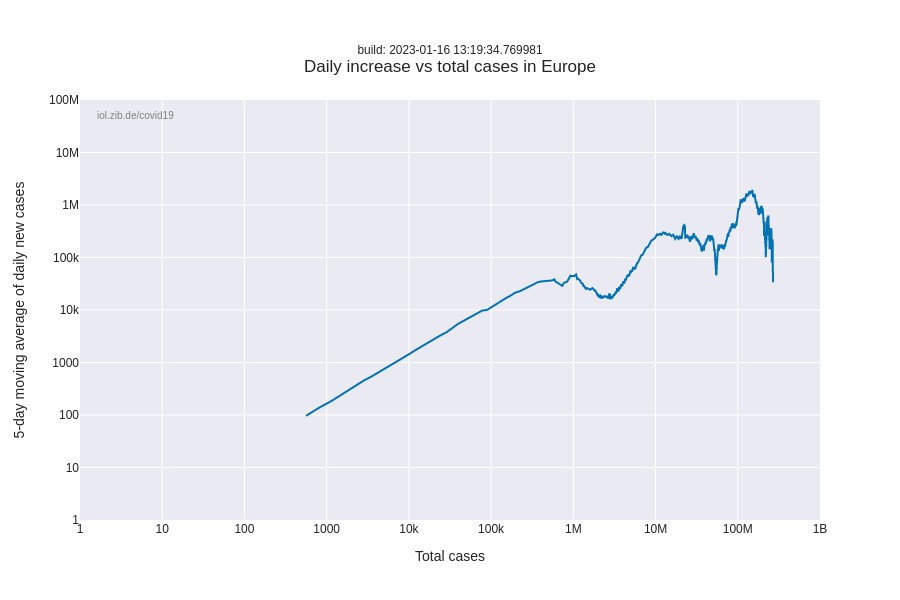
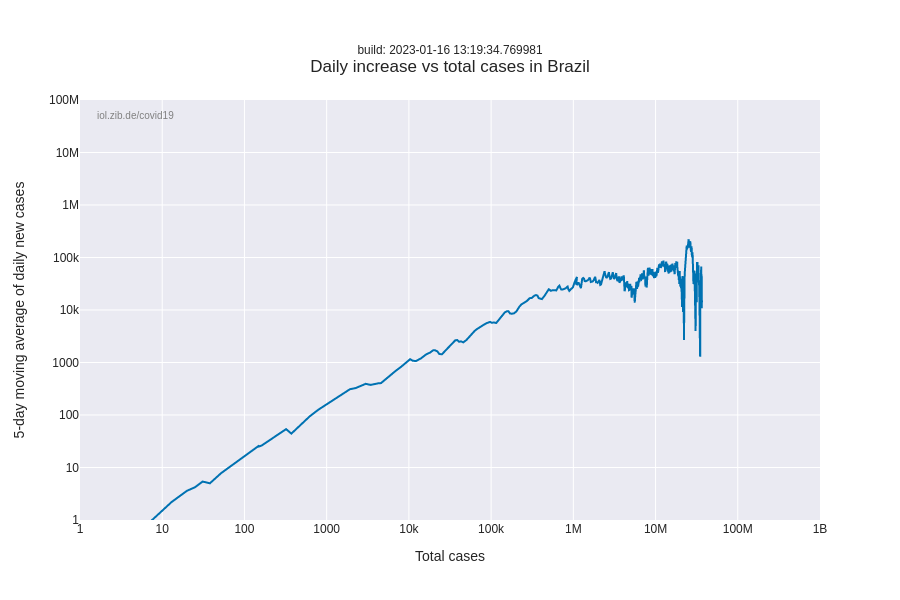
Infection Rate Graph. This graph is strongly inspired by Covid Trends of Aatish Bhatia and plots the number of new cases vs. cumulative cases. What is plotted can be understood as a proxy for the infection rate. It is independent of absolute time and allows for easier comparison. Unmitigated infection becomes a straight line in this graph (with slope 1 and the rate r becoming an additive offset of magnitude logarithm of r). Moreover, mitigation and effectiveness of measures such as curfews and lockdowns become apparent due to sharp drops and bending of the respective country line. This graph is slightly lagging in time as averaging of the data is necessary to handle noise.
Inconsistencies between locations. Currently, the models are computed independently of each other. This can lead to inconsistencies, e.g., between forecasts worldwide and specific countries. This is to be expected and we are aware of this. Simplifying matters, the reason is that worldwide cases are the sum of cases by country. As of now, this mix is mostly dominated by cases from China which virtually came to a stop. At the same time, emerging locations have very short doubling times. So individual location contributions that are insignificant and washed out right now might be dominating a few days down the road. As such in particular, the long range predictions might be incompatible, which means that the contributing factors for at least one of the locations will have to change in the long run. We are considering whether and how to enforce long range consistency as with the current modeling this might create biases on the short end.
Comparisons to other locations. The compare dropdown allows to compare to benchmark locations. The corresponding benchmark location progression (in red with red bands) is shifted in time, so that both locations encounter at least 100 confirmed cases for the first time on the same day to compare evolution over time.
Graphs by Country
Benchmark
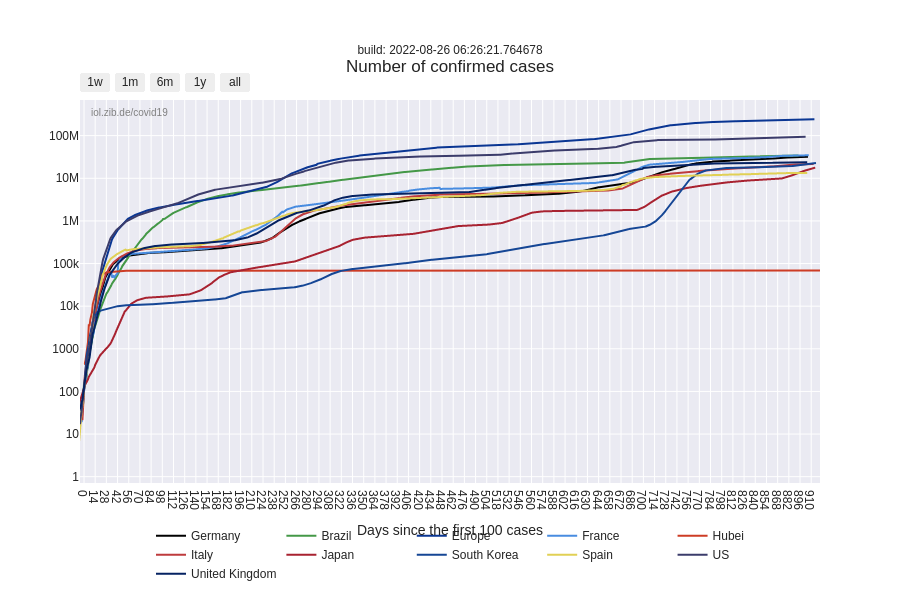
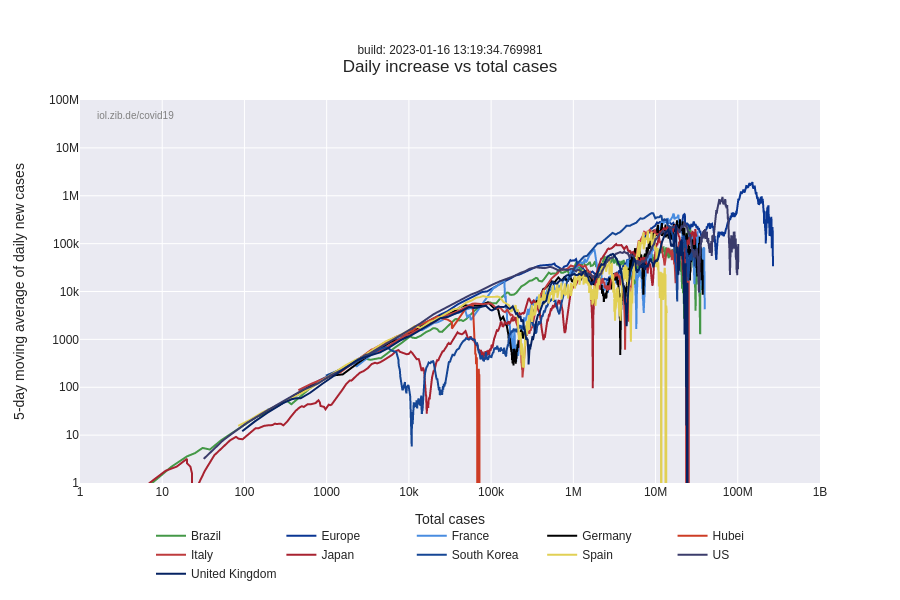
Overview of select benchmark countries.
Benchmark (relative to population)
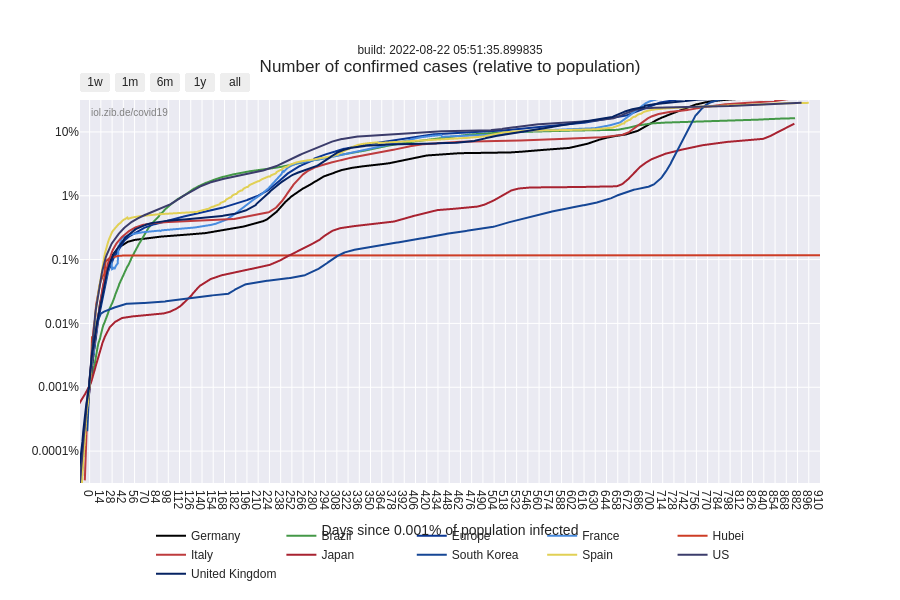
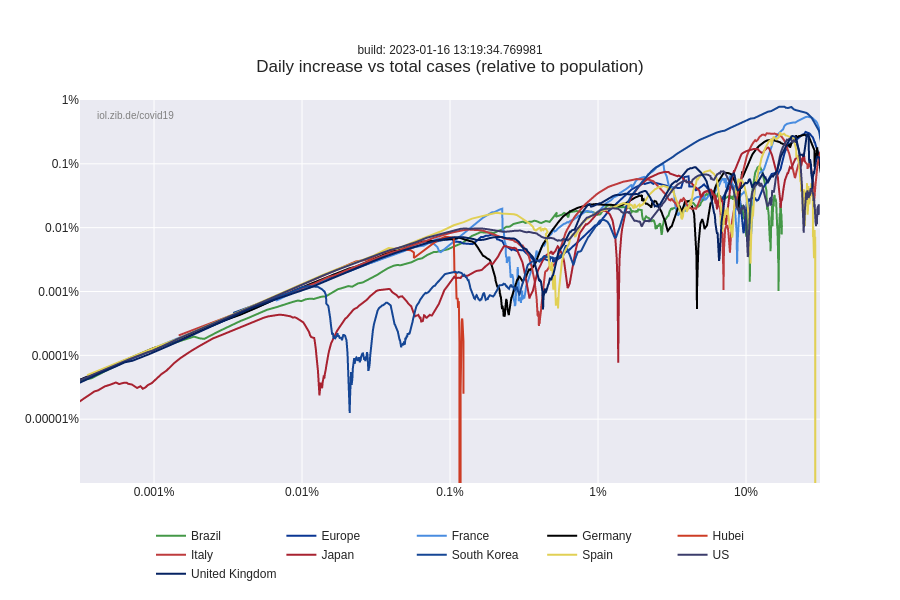
Overview of select benchmark countries relative to country population.
Worldwide
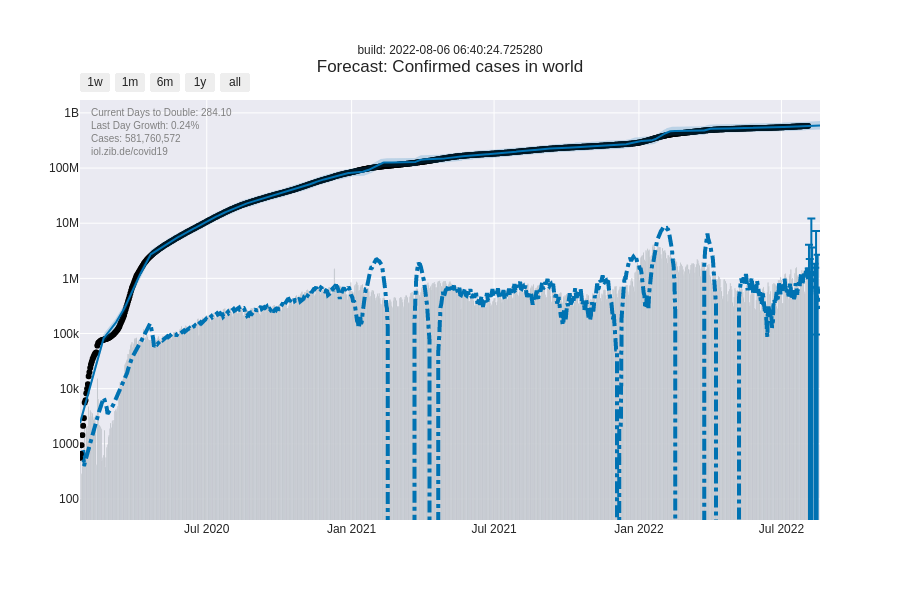
Worldwide confirmed cases. Around mid-February 2020 the number of new confirmed cases outside of China began to rise sharply.
Germany
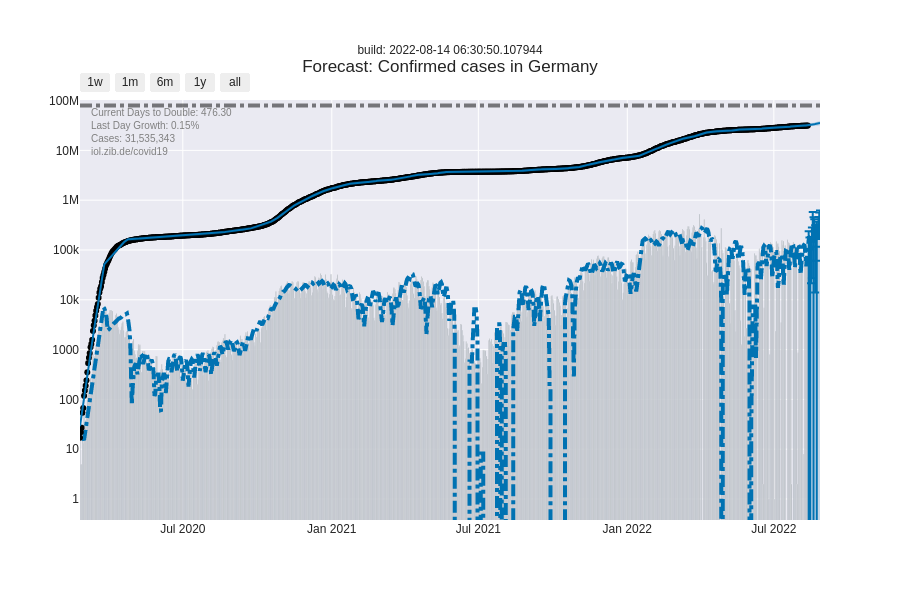
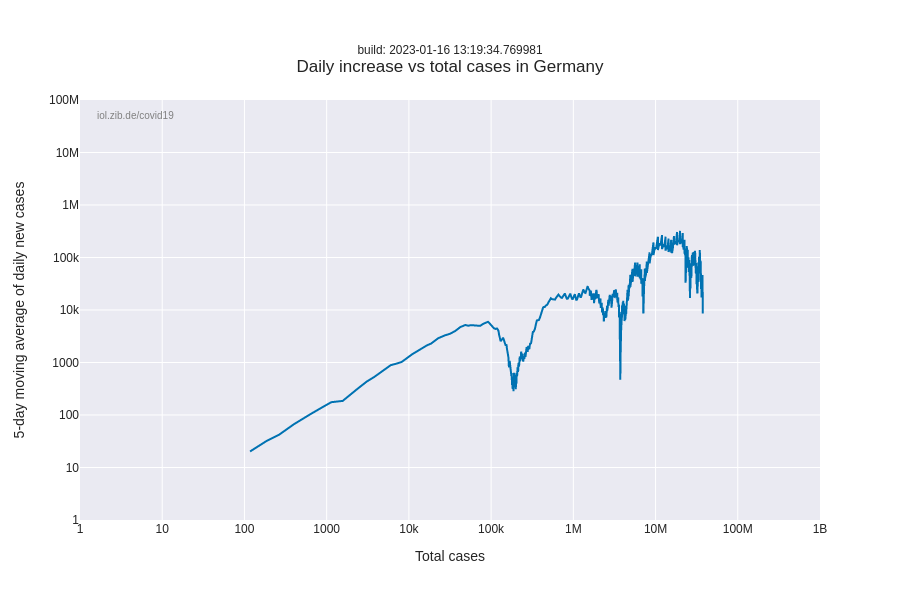
The first confirmed COVID-19 cases in Germany were reported on 27 February 2020. The sudden increase in cases was reported by several news media as infections were traced back after positive testing of the first patients. Note: Early numbers may not be reliable as underreporting and under testing might have taken place. As of 23 March 2020, Germany is gradually implementing curfews and restricted gatherings of groups greater than two, as hospitals prepare for an increasing wave of hospitalized COVID-19 cases. Interestingly, Germany reports some of the lowest death rates.
United States
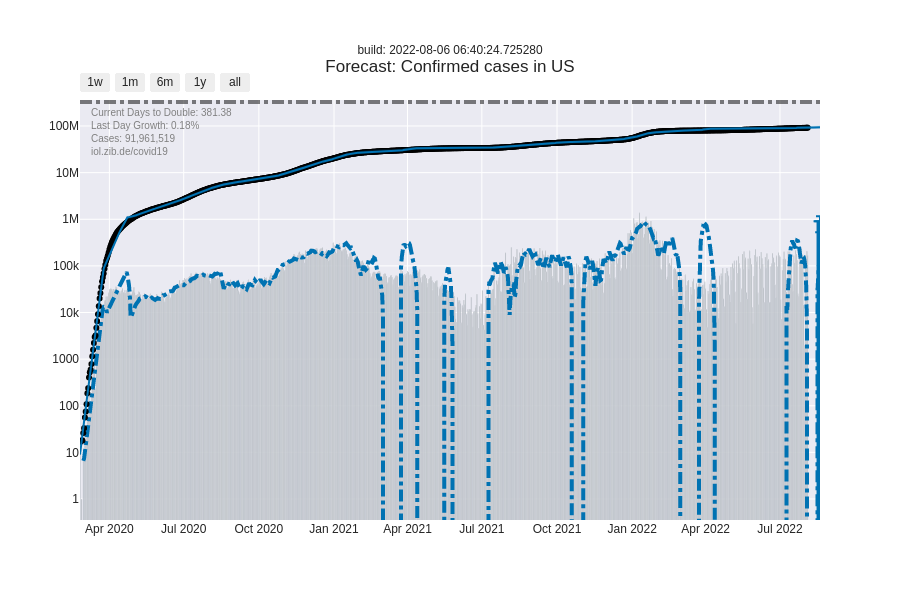
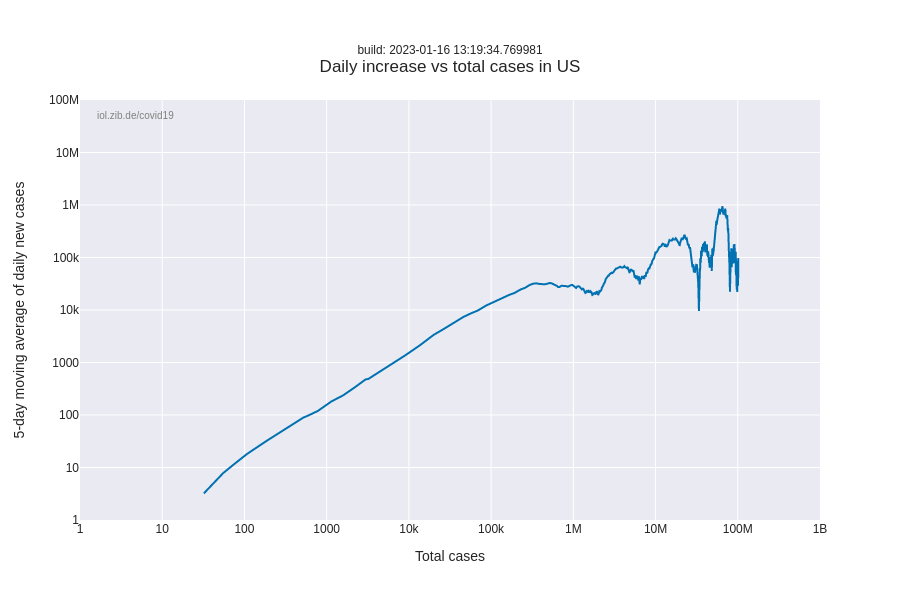
The first COVID-19 cases were announced on 21 January 2020 in Washington State. Infections have surged since with new confirmed cases in, as of 15 March 2020, 49 states across the U.S. as The New York Times reports. U.S. has implemented contact tracing, widespread school closings, recommended self-quarantine and restricted international travel. Several news media report warnings that the epicenter of the pandemic could shift toward the US with 55,000 cases on 23 March 2020. On 26 March 2020 the US became the new epicentor of the pandemic, surpassing China and Italy with number of confirmed infections.
Italy
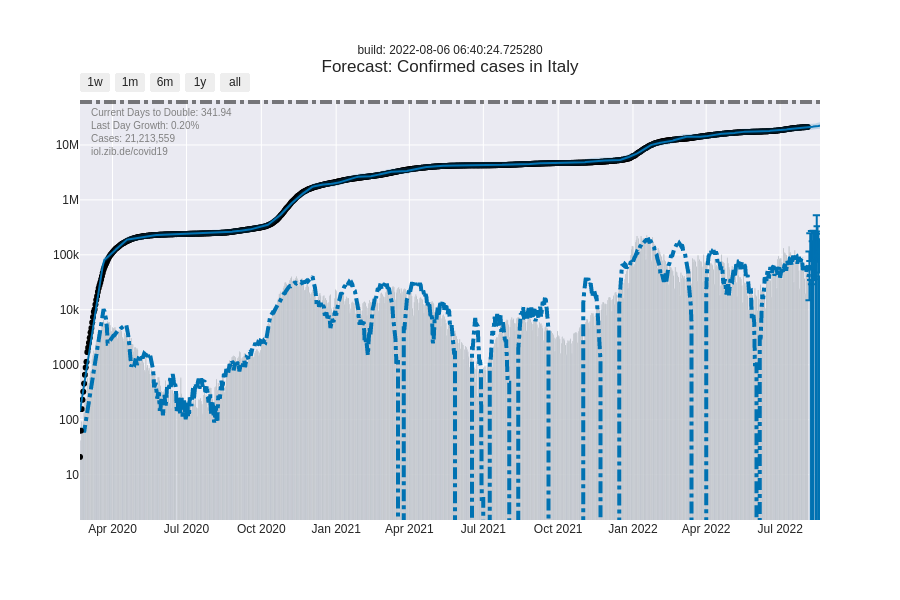
Italy recorded its first COVID-19 case on 20 February 2020. Disease numbers and new infections have since surged. As of 14 March 2020, Italy reports the highest numbers of infections outside of China. Time analyses of the outbreak suggest a spread of SARS-CoV-2 long before the first case was detected. As of 23 March 2020, Italy reported the highest single-day increase with 793 additional deaths. It has surpassed China as the country with the highest death toll, becoming the epicenter of a shifting pandemic, as the New York Times reports While China is reporting its second day of “zero new infections”, Italy’s infection numbers continue to surge surpassing China’s, marking Europe as the new epicenter of the COVID-19 pandemic.
France
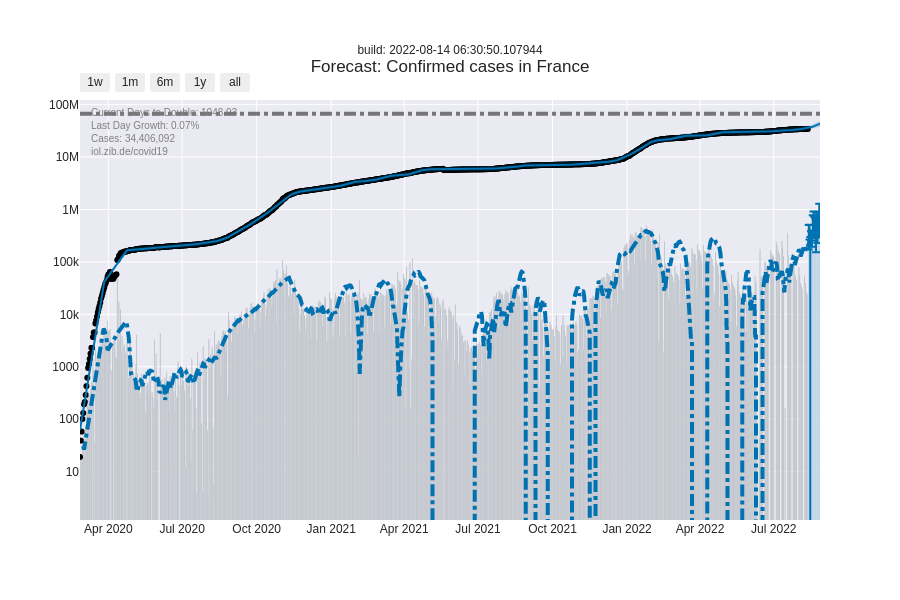
The first confirmed COVID-19 cases appeared on 24 January 2020 in France. As of 16 March 2020, France has issued a national curfew.
Spain
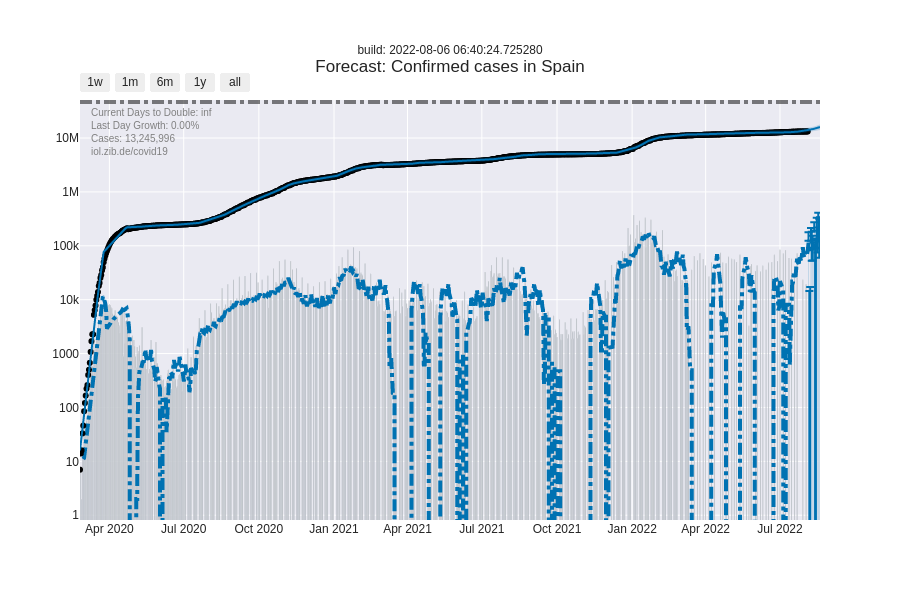
First cases of COVID-19 spreading to Spain were confirmed on 31 January 2020. On 13 March 2020 Spain declared a state of emergency.
United Kingdom
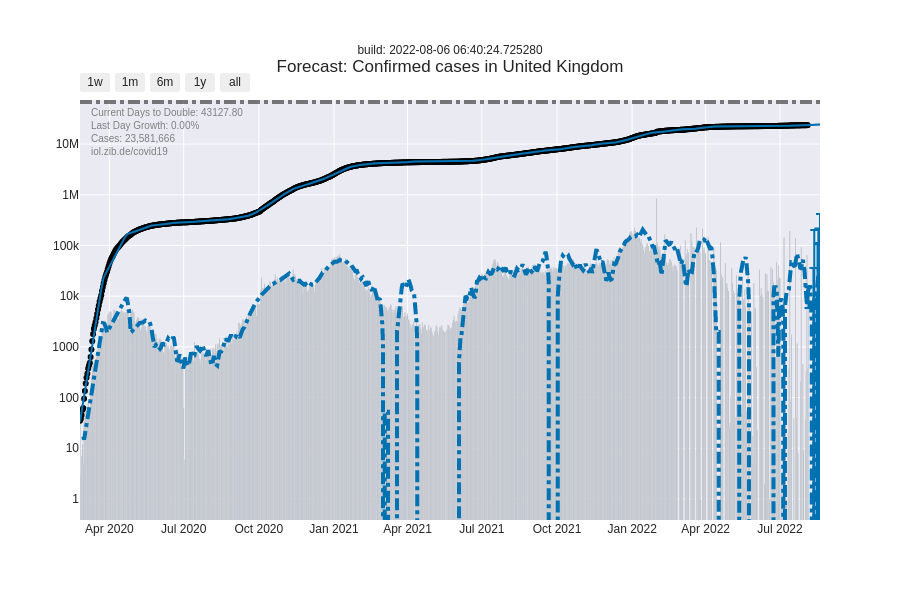
The first COVID-19 cases were identified in the UK on 29 January 2020. A range of measures have since been proposed to cap infection rates but UK has been reluctant in their implementation (such as school cloures, restrictions on public transport, stopping big gatherings, social distancing).
Hungary
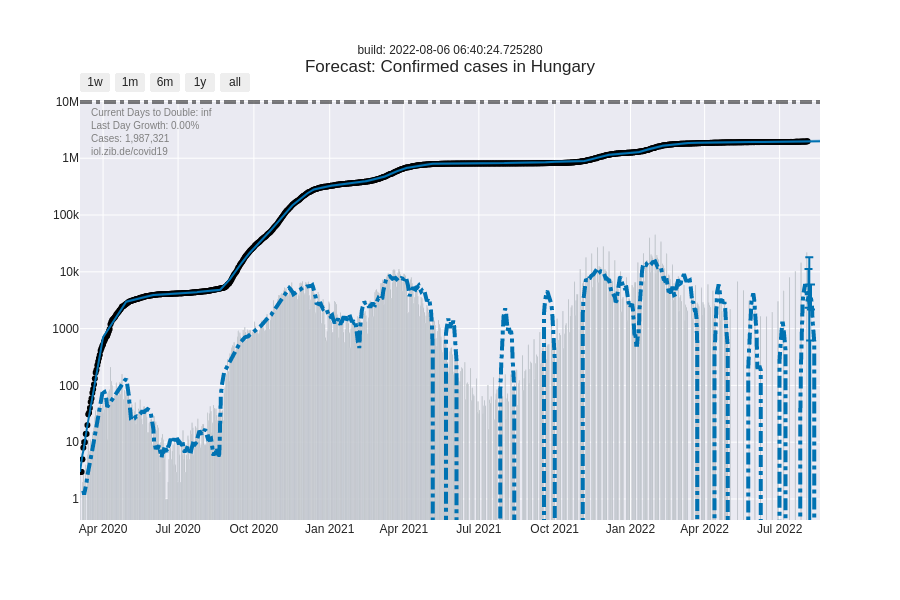
The first two COVID-19 cases were confirmed on 4 March, and like most of Europe, Hungary introduced lockdown on 15 March 2020, which was lifted at the beginning of summer. According to a representative mass test H-UNCOVER, a collaboration of several universities conducted in the first half of May 2020, only a tiny fraction of the population above 14 years has been infected, hence most of the infections happened in hospitals and senior homes.
At the end of August the number of new infections started to increase rapidly, mostly among young adults, which is believed to be due to community spread in large gatherings. Since the first days of September 2020, the rate of positive tests exceeds the WHO recommended 5% threshold, making numbers less reliable, as approaching the test capacity limit.
Compare with other diagrams for a complete picture (the government’s official page on COVID-19 was shut down in early 2023).
Europe
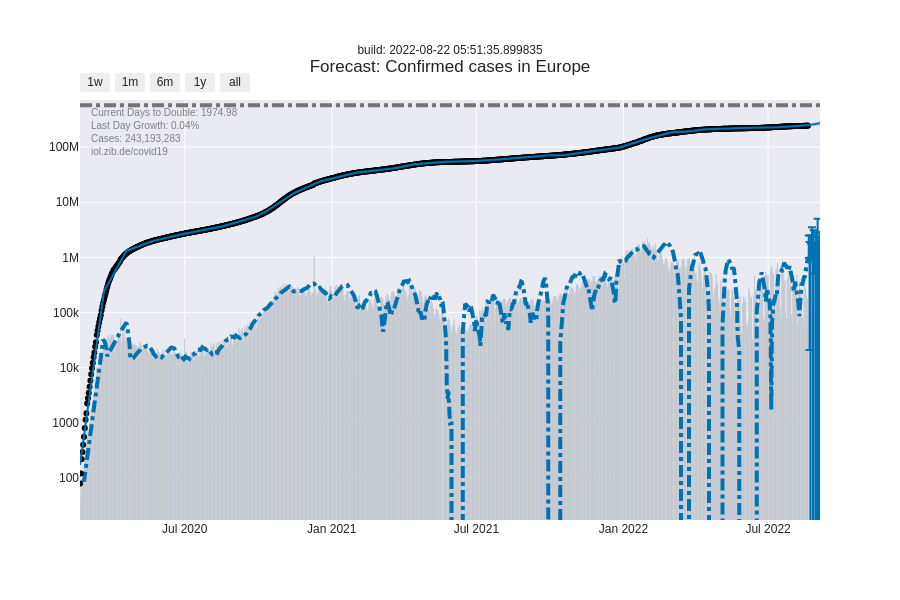
Aggregate cases for Europe. Europe was the COVID-19 epicenter between March and May in 2020.
Japan
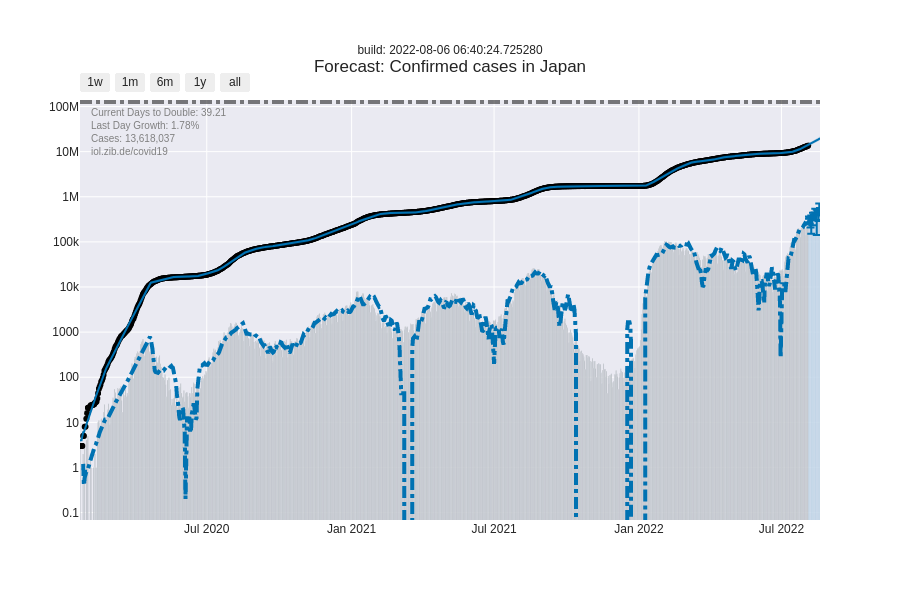
The first confirmed cases of COVID-19 appeared in Japan on 16 January 2020. The numbers of new infections have since continued to rise steadily, although at a much slower rate than in other countries. Japan has since imposed travel restrictions. Schools closed on 27 February 2020. On 3 February 2020 the Diamond Princess cruise ship docked in the port of Yokohama. Diamond Princess data is not included in the figures shown. As of 24 March 2020, Japanese nationals celebrate the cherry blossoms, drawing crowds despite government issued warnings.
South Korea
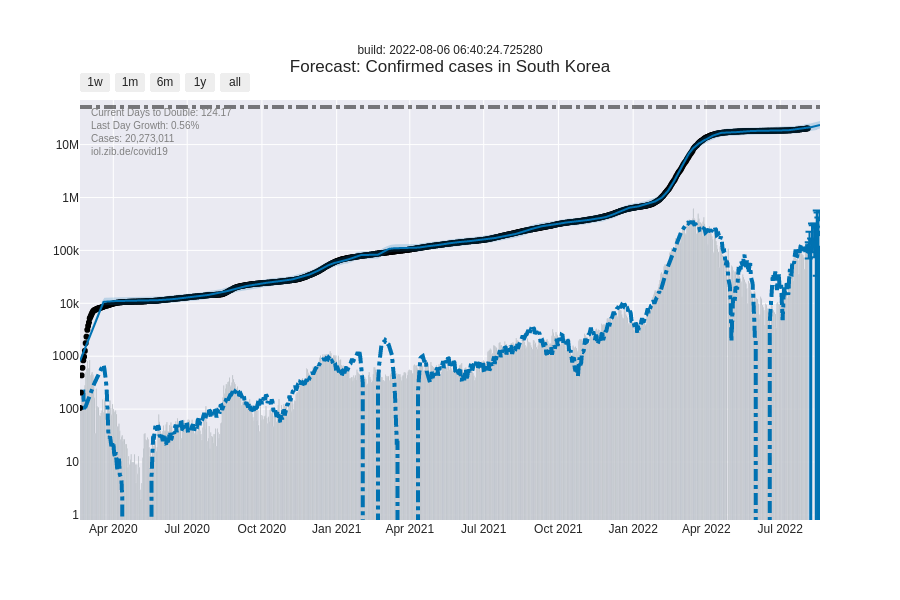
First confirmed COVID-19 cases appeared on 20 January 2020 in South Korea. As of 13 March 2020 Korea Centers for Disease Control and Prevention (KCDC) report receding numbers of new infections as reported by Reuters. Initially South Korea had reported the highest numbers of infections outside of China, but has since been overtaken by many countries. It is one of the countries responding with a large and well organized epidemic control program.
Hubei
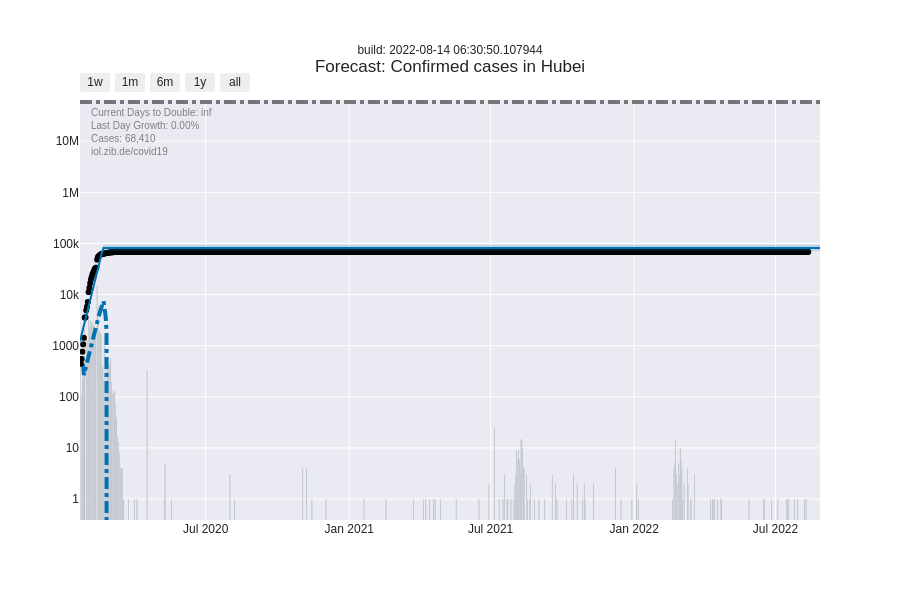
The first confirmed case of COVID-19 was diagnosed in the Hubei province of China on 8 December 2019. News media report that cases can be traced back as early as 17 November 2019. The Hubei province has been under lockdown since 23 January 2020 and case numbers have plateaued with receding numbers of new infections.
Iran
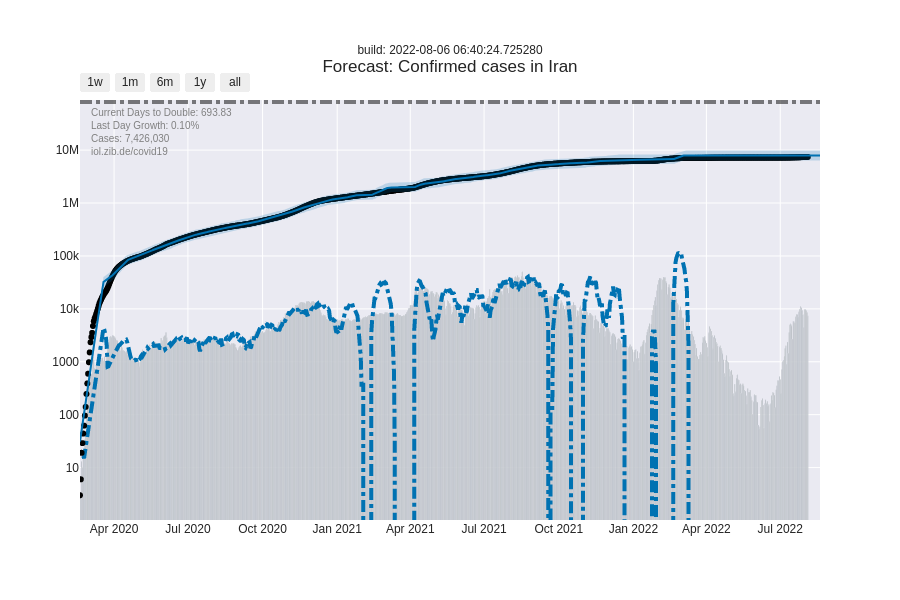
Iran reported its first confirmed cases of COVID-19 appeared on 19 February 2020. Several news media have since reported that this is likely an undercount.
India
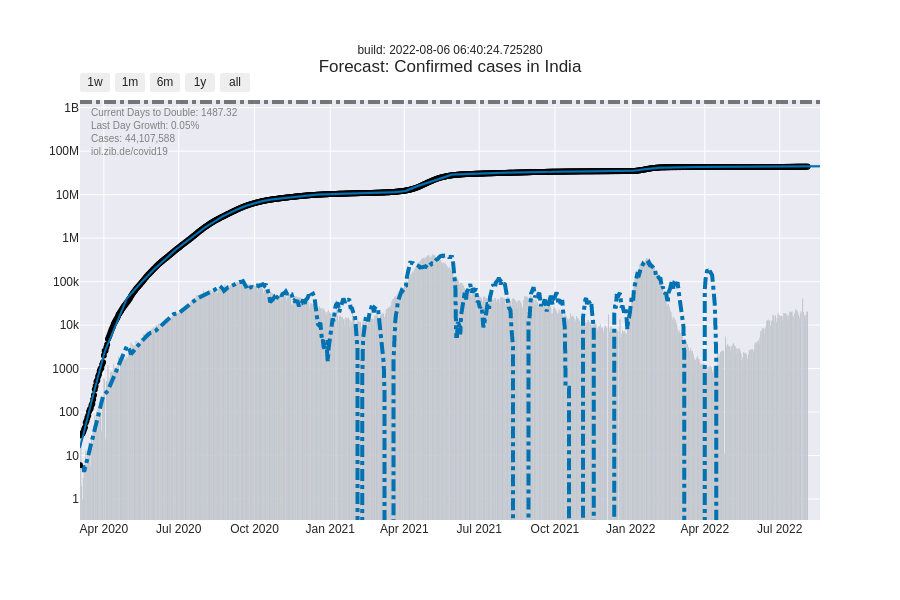
The first COVID-19 cases were reported on 30 January 2020. By 15 March 2020 a total of 107 COVID-19 cases were reported. India is maximizing efforts to contain the spread, implementing travel bans starting 13 March 2020. As of 26 March 2020, India is under complete lockdown with merely 600 confirmed infections as the NYT reports.
Australia
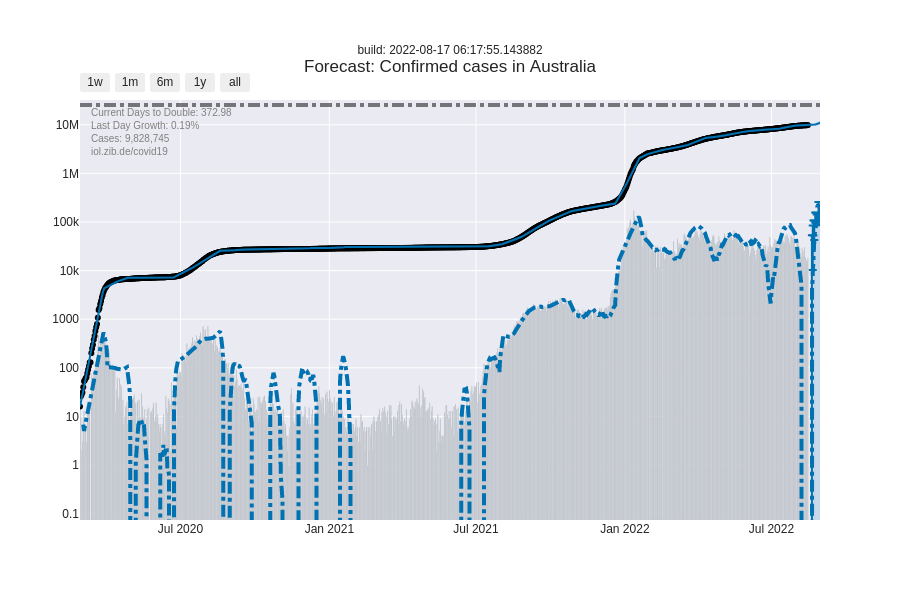
The first confirmed case in Australia was recorded on 25 January 2020. Australia had issued screening of travelers from Wuhan since 23 Janury 2020, identifying positive COVID-19 cases. On 19 March 2020, Australia closed its borders to all non-residents and non-Australian citizens. Social distancing rules of 4 square meters per person was imposed. On 21 March 2020, mandatory closure of non-essential services.
Indonesia
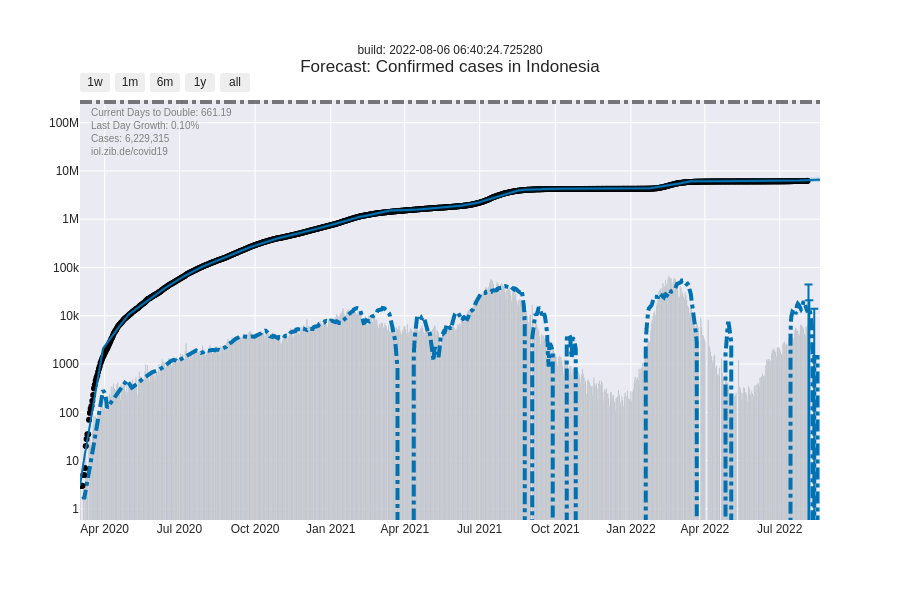
First COVID-19 cases were reported on 2 March 2020. The infections have since spread rapidly to 24 provinces. Indonesia had banned all flights to and from Mainland China as early as 5 February 2020. Expansion of the travel restrictions to include South Korea, Italy and Iran was issued 8 March. On 17 March 2020, this travel restriction was further expanded to Iran, Italy, Vatican City, Spain, France, Germany, Switzerland and UK. Infection numbers continue to surge as Jakarta Post reports.
Sweden
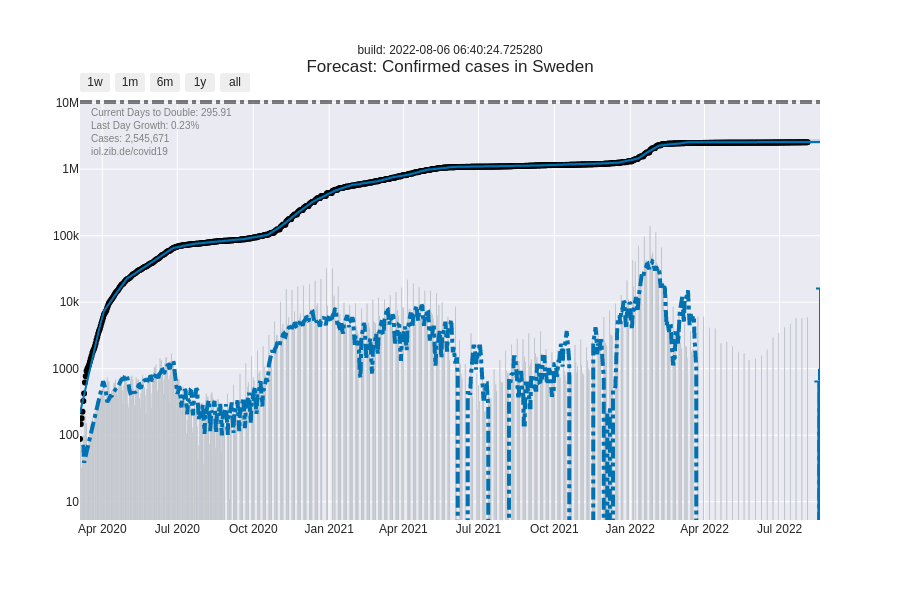
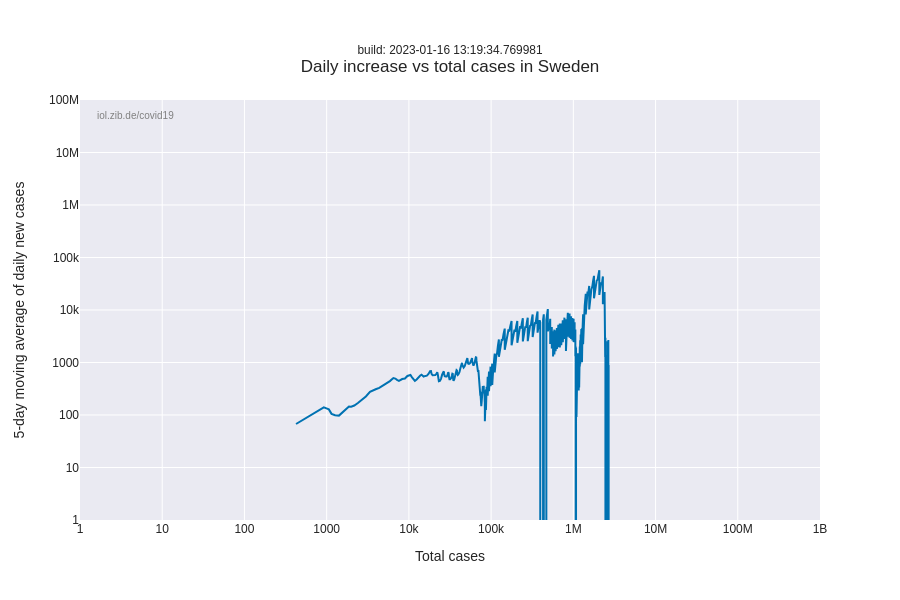
Unlike other European countries, Sweden introduced few compulsory restrictions, and relied mostly on people voluntarily following recommendations.
Russia
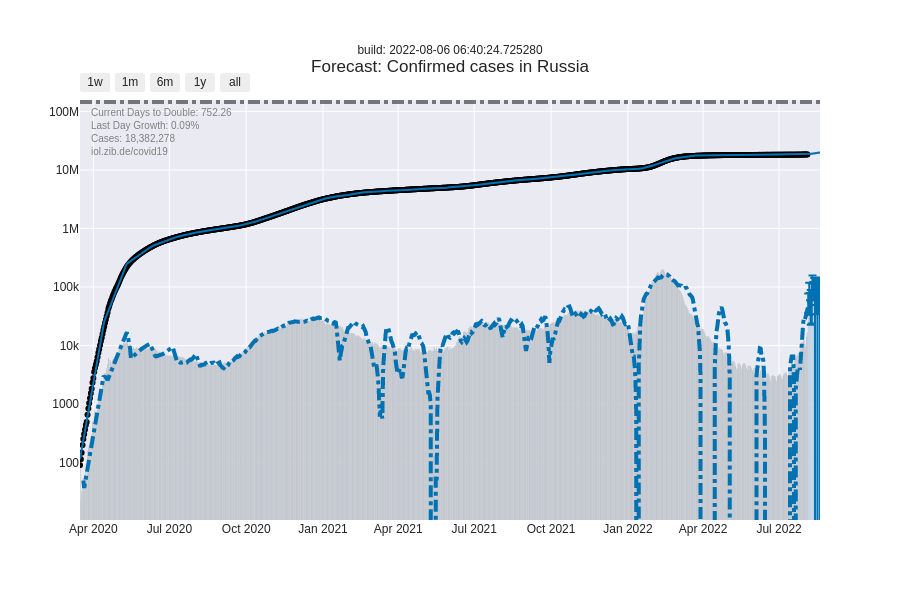
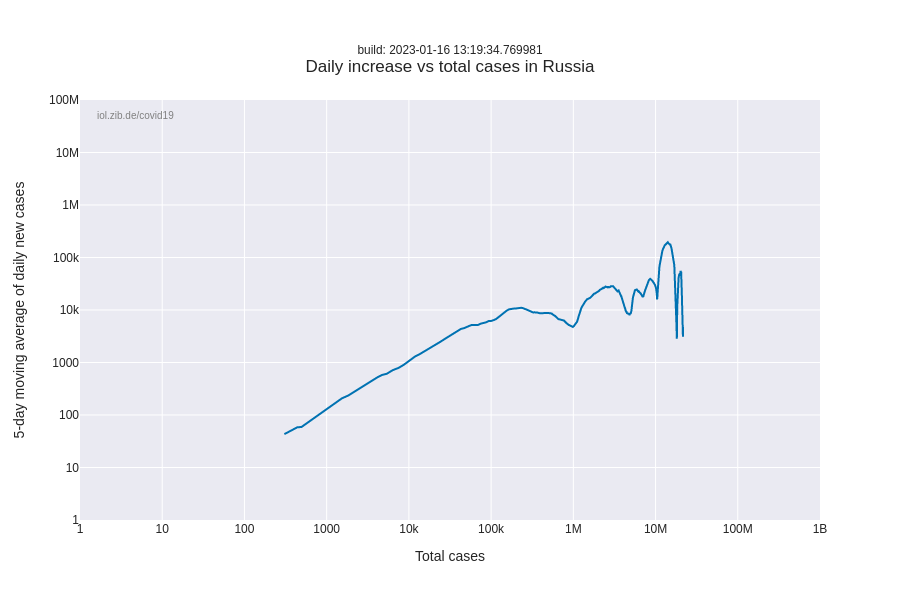
First COVID-19 cases in Russia surfaced around March 2 2020. Russia had closed down its border with China on January 30 in response to the outbreak. Lockdown measures began around March 30 as the number of new cases soared, although the reported numbers have been questioned by experts. As of June 9 Mayor Sergei Sobyanin announced that Moscow would end its self-isolation orders as Russia planned to begin re-opening its borders to foreign nationals.
Turkey
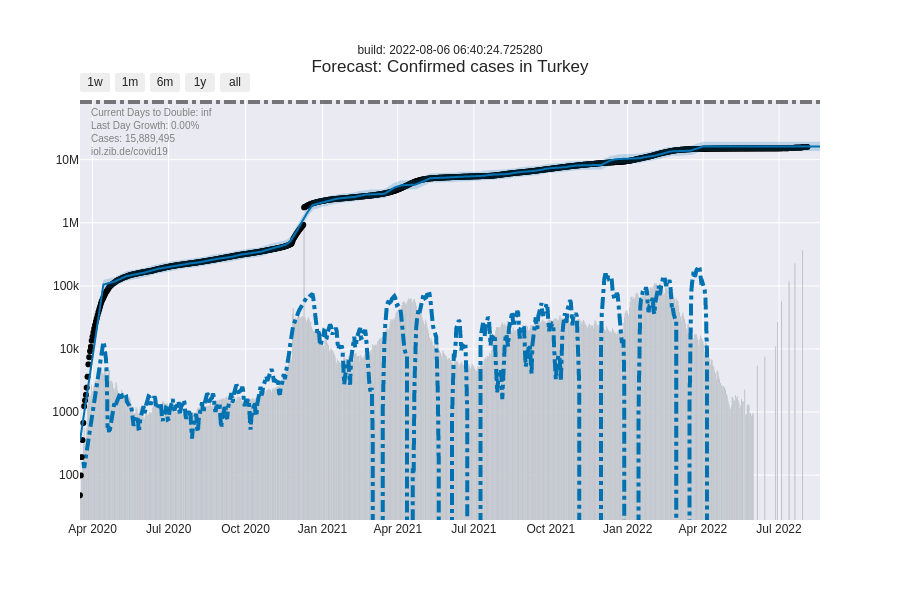
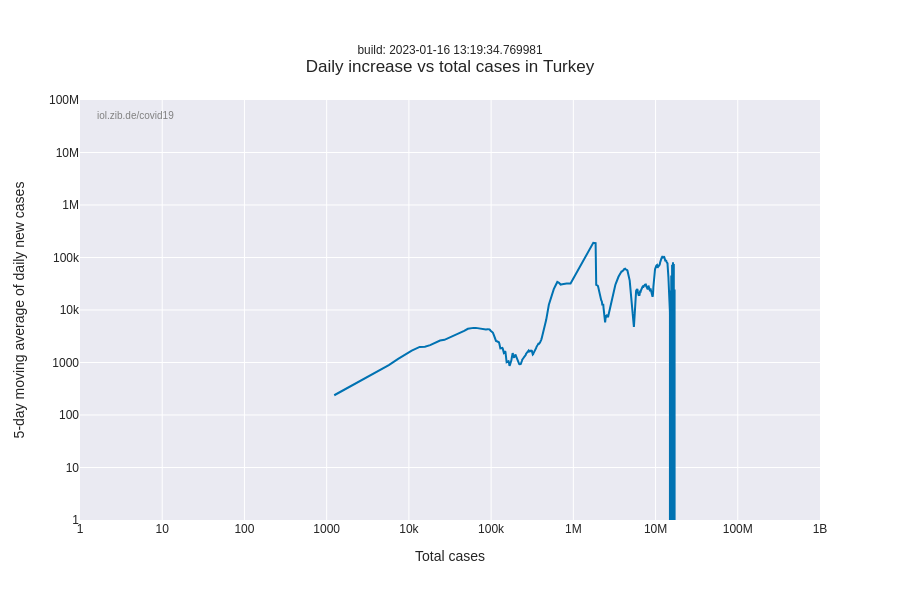
Turkey announced first confirmed COVID-19 on March 11 2020. Testing, tracing, isolation and movement restrictions have since been implemented. Complete lockdowns were imposed on only selected groups, weekend curfews were introduced. Lockdown restrictions were gradually eased in mid-May.
Brazil
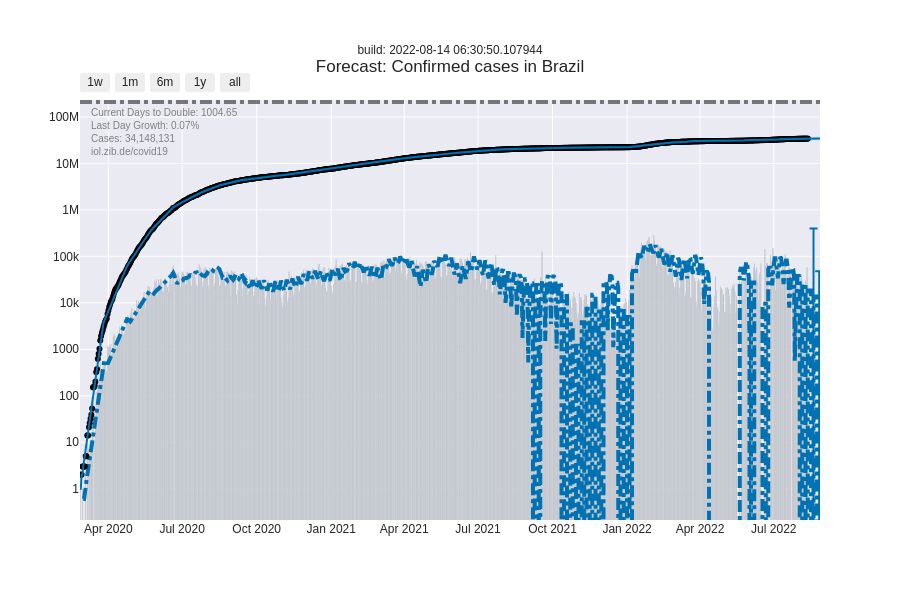
The first recorded COVID-19 case showed up in Brazil on February 25, 2020. Case numbers surged and Brazil’s hospitals reached their breaking points and governors implemented lockdowns and restrictions. Confirmed case numbers surpassed 500,000 on May 22 and infection rates continued rising, becoming the new epicenter of the pandemic. Brazil’s President Jair Bolsonaro has fought lockdowns and pushed for re-opening of the economy. Despite surging case numbers, Brazil eased lockdowns beginning of June.
Other trackers, dashboards, and resources
Additional resources for background information and alternative approaches, etc.
Trackers and dashboards (COVID-19 specific)
- Johns Hopkins Dashboard. Probably the earliest and most used one.
- Coronavirus App. Another worldwide tracker with for pay API.
- COVID-19 in Australia. Specifically for Australia.
- Japan COVID-19 Coronavirus Tracker. Specifically for Japan with live patient database.
- SEIR dashboard. Interactive dashboard to explore the vanilla SEIR model under rate reduction due to countermeasures.
- COVID-19 Scenario simulations. Effectiveness of measures per simulation obtained with Epidemic simulation based on MATSim of TU Berlin’s Transport Systems Planning and Transport Telematics group.
- NPGEO Corona Hub 2020. Various COVID-19 dashboards for EU countries.
Papers, models, and other resources
- Infection spread under countermeasures (Germany only). Simulation-based spread model from ZIB assessing participation in counter measures vs. spread for COVID19-like diseases.
- Impact of non-pharmaceutical interventions (NPIs) to reduce COVID19 mortality and healthcare demand by Ferguson et al.
- Responding to Covid-19 — A Once-in-a-Century Pandemic? by Bill Gates.
Used Software Packages
Acknowledgements
We gratefully acknowledge the many pointers to bugs and additional resources that we have received.
Changelog
- 6/12/2020: added more countries. Added comparisons relative to country population.
- 3/29/2020: added comparisons to benchmark locations
- 3/27/2020: added additional resources. improved model - details to follow
- 3/26/2020: PRESENTATION ONLY: added responsive layouts
- 3/25/2020: switching to interactive graphs. work in progress. Added Indonesia and United Kingdom per request.
- 3/24/2020: adjusted for changes in data source. No active daily cases anymore. Added Australia per request.
- 3/21/2020: added doubling rates and daily changes.
- 3/16/2020: added more countries. added remark re inconsistencies.
- 3/15/2020: added US and added additional information per location.
- 3/14/2020: adjusted prediction models.