
[ German | English ]
COVID-19 Models for Berlin
COVID-19 caused by the novel virus SARS-CoV-2 (severe acute respiratory syndrome Coronavirus 2) is currently spreading across the globe. The first confirmed COVID-19 case hit Berlin on 1 March 2020 and was treated at Charité Berlin Campus Virchow. Our objective is to track and monitor infections for Berlin, Germany as well as model predictions using data-based and model-based approaches.
Disclaimer. Forecasts may be very unreliable due to the fact that forecasts are based on the presumption that no factors change. As regulations are implemented to control new infections and reduce disease spread, influencing factors are due to change and predictions will adjust accordingly. As a rule of thumb, the further out the prediction, the less reliable; also bear in mind that the confidence bands are only at 80%.
IMPORTANT. Do not use for any decision-making etc.
#dontbeavector
Methodology
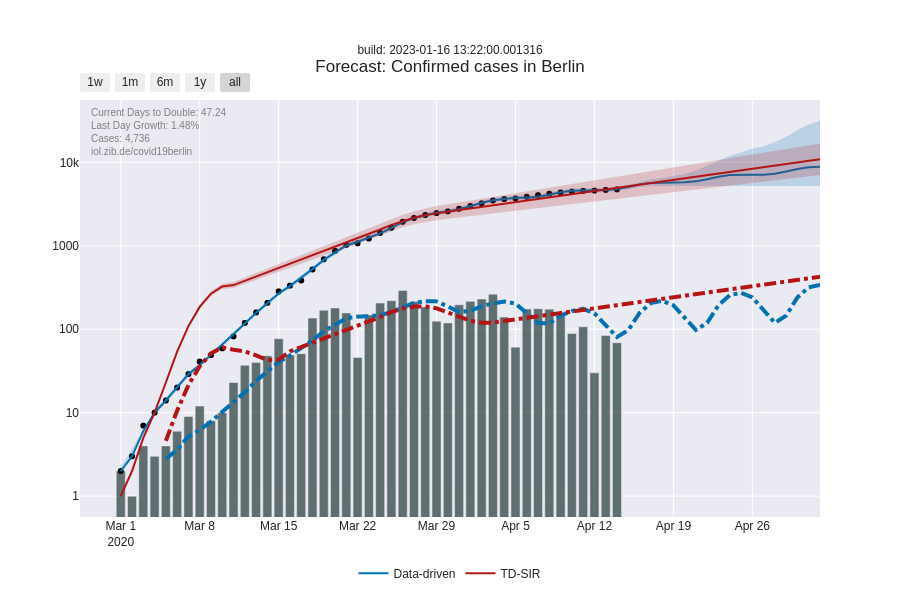
We used two approaches to model disease spread. One approach is model-based, which is calibrated against the data, while the other is a model-free data-driven approach, where the spread is predicted purely from data.
Model-based approach
We constructed a rather simple infection spread model based on the well-known SIR and SEIR models but with time-dependent infection rates that allow to incorporate the different phases of spreading control implemented by the respective authorities (states, regions, cities). The model is fitted to the available data by means of classical parameter estimation as well as by Bayesian uncertainty quantification. Predictions based on the model are computed daily when new data become available. The uncertainty of the prediction reflects inaccuracy of reporting as well as sparseness of data. The model used herein is as reduced as possible in order to cope with sparse and incomplete data. A much more elaborated epidemic simulation is based on MATSim.
Data-driven approach
We developed a simple model to monitor confirmed COVID-19 cases and we use the Facebook Prophet library. Generally, predictions are highly unreliable because data is currently quite sparse and reporting may not be accurate. Moreover, important factors may change quickly. Computed models are updated regularly (once every hour) as infections spread; current data source provides updated data only once per day though. Models are likely to improve over time as more data becomes available and forecasts may vary as a result of changes in influencing factors. Note: The model is updated once per hour and data implemented as it is provided to us.
Result Presentation
General comment regarding figures. The scale in the confirmed cases figures is logarithmic to base 10.
Confirmed cases figures depict number of confirmed cases and predict the number of new infections with a confidence interval of 80% (blue area).

Team
- Prof. Dr. Tim Conrad
- Prof. Dr. Sebastian Pokutta (corresponding author)
- Prof. Dr. Christof Schütte
- Dr. Gábor Braun
- Dr. Nataša Conrad
- Christoph Spiegel
Used Software Packages
Related References
- Müller et al, “Mobility traces and spreading of COVID-19” (2020) pdf
Changelog
- 3/31/2020: both models online / improved presentation
- 3/27/2020: improved model - details to follow
- 3/26/2020: PRESENTATION ONLY: added responsive layouts
- 3/25/2020: very basic initial model / data-driven part only